Monitoring page
The Developer Perspective will have a single Monitoring item in the navigation. Both the project and application selector are available on the Monitoring page. This page is not shared with the Administrator Perspective. The monitoring page will have a number of tabs available:
- Dashboard - allows the user to see out of the box project metrics
- Metrics - allows the user to run out of the box metrics queries AND run their own ad-hoc queries
- Events - allows the user to see Event associated with the current project. Note that Events secondary nav item should be removed from Advanced
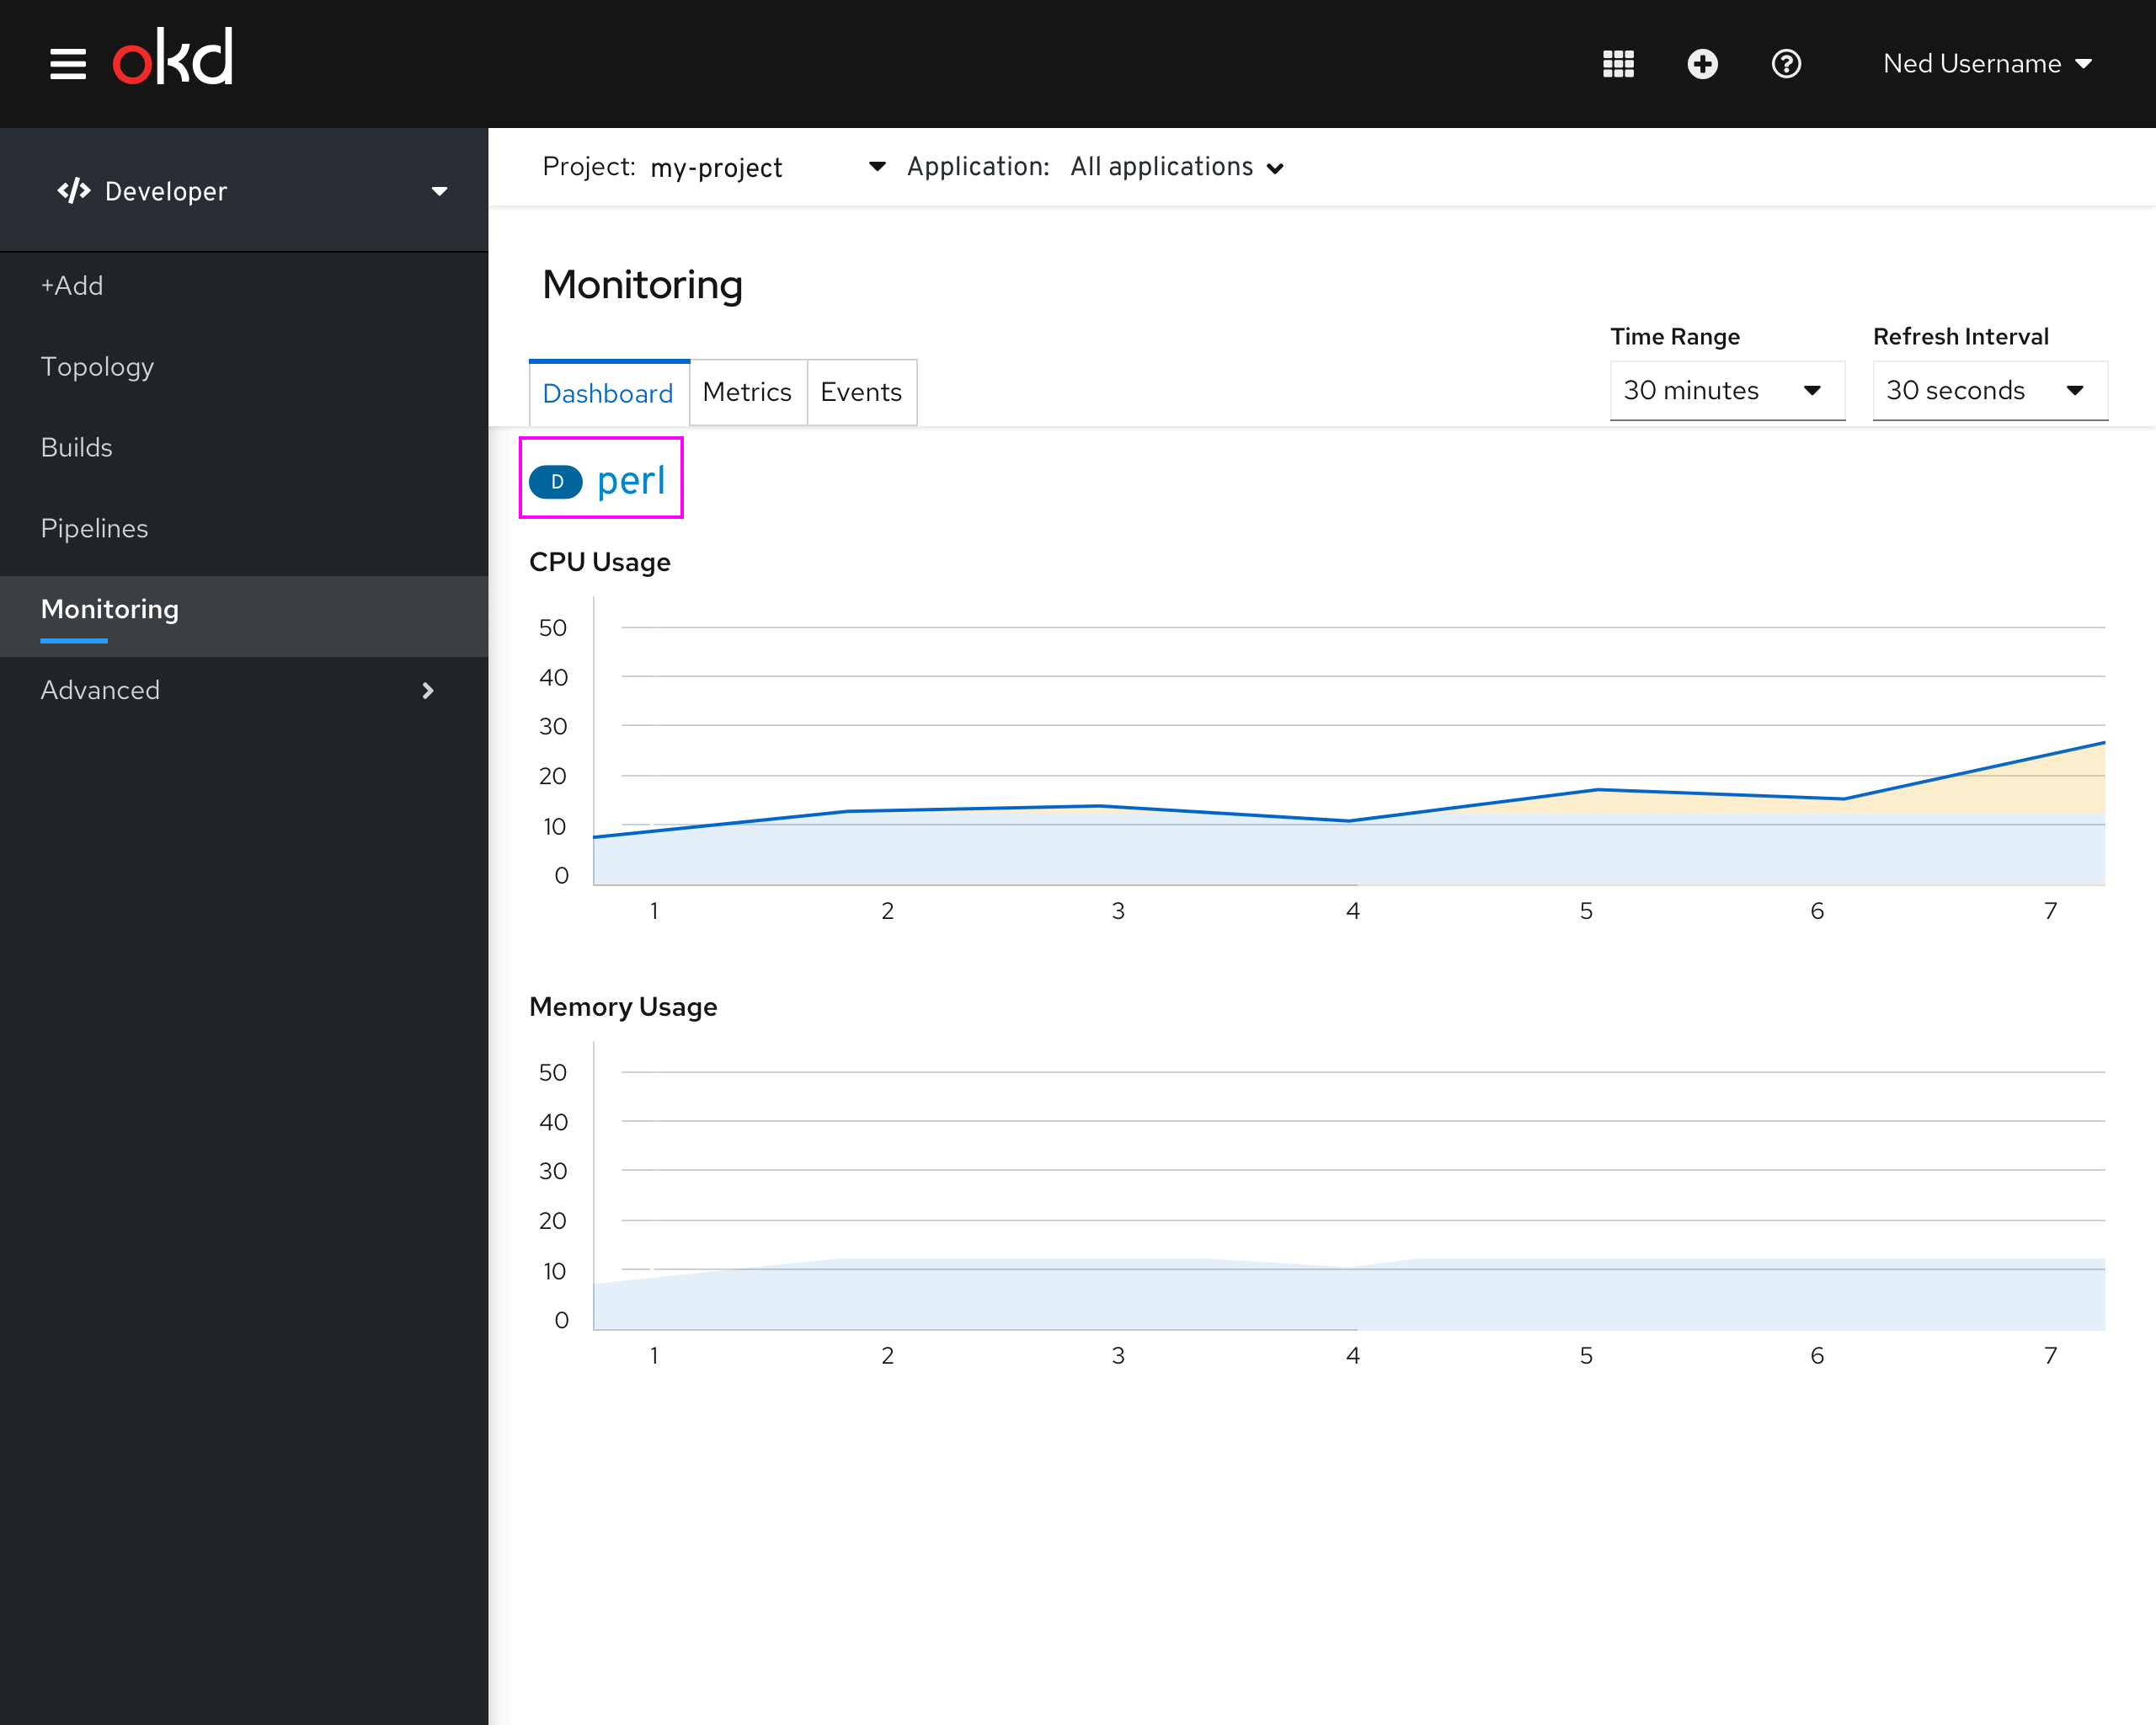
Monitoring - Dashboard tab
- The monitoring dashboard allows you to see metrics per project.
- For 4.4, the out-of-the-box cards will focus on pod, network & storage metrics.
- The application selector allows the user to quickly view metrics for the entire project OR per application.
- There is a Time Range & Refresh Interval (for 4.4, this only applies to the dashboard)
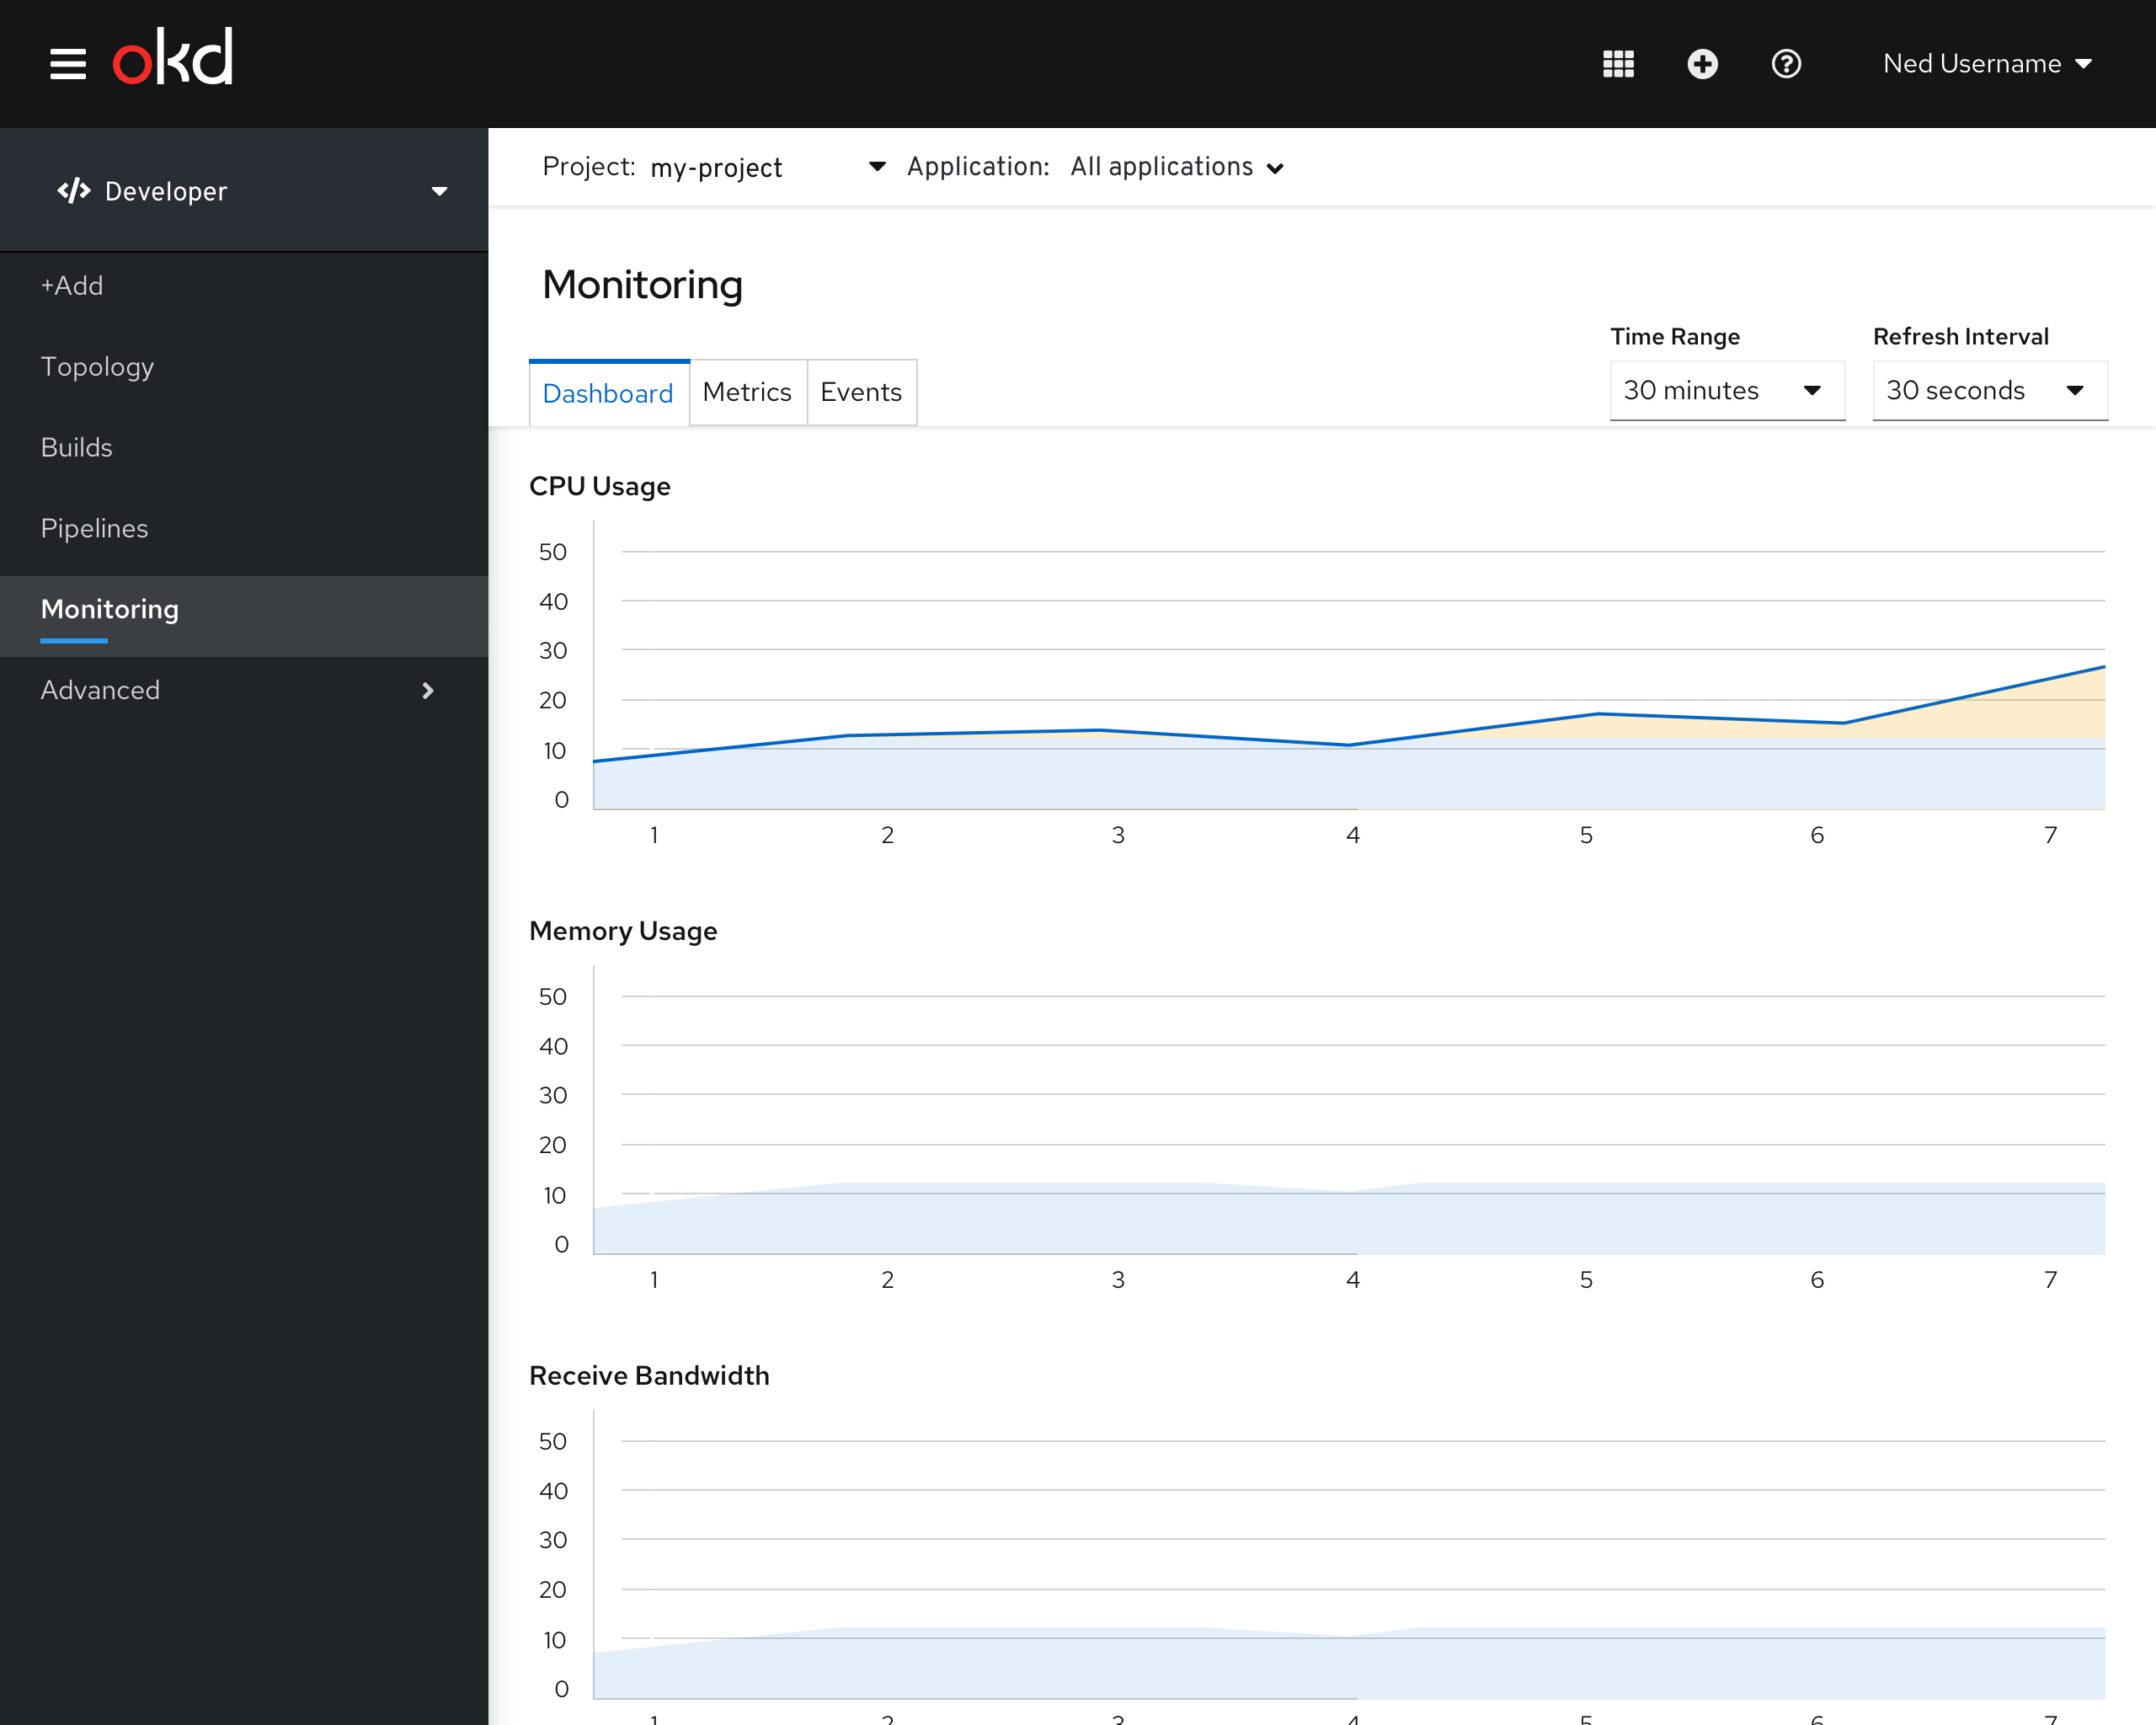
Available Charts
- CPU Usage
- Memory Usage
- Receive Bandwidth
- Transmit Bandwidth
- Rate of Received Packets
- Rate of Transmitted Packets
- Rate of Received Packets Dropped
- Rate of Transmitted Packets Dropped
Monitoring - Metrics tab
The metrics tab allows the user to view of out-of-the-box metrics queries OR RUN their own query via PromQL.
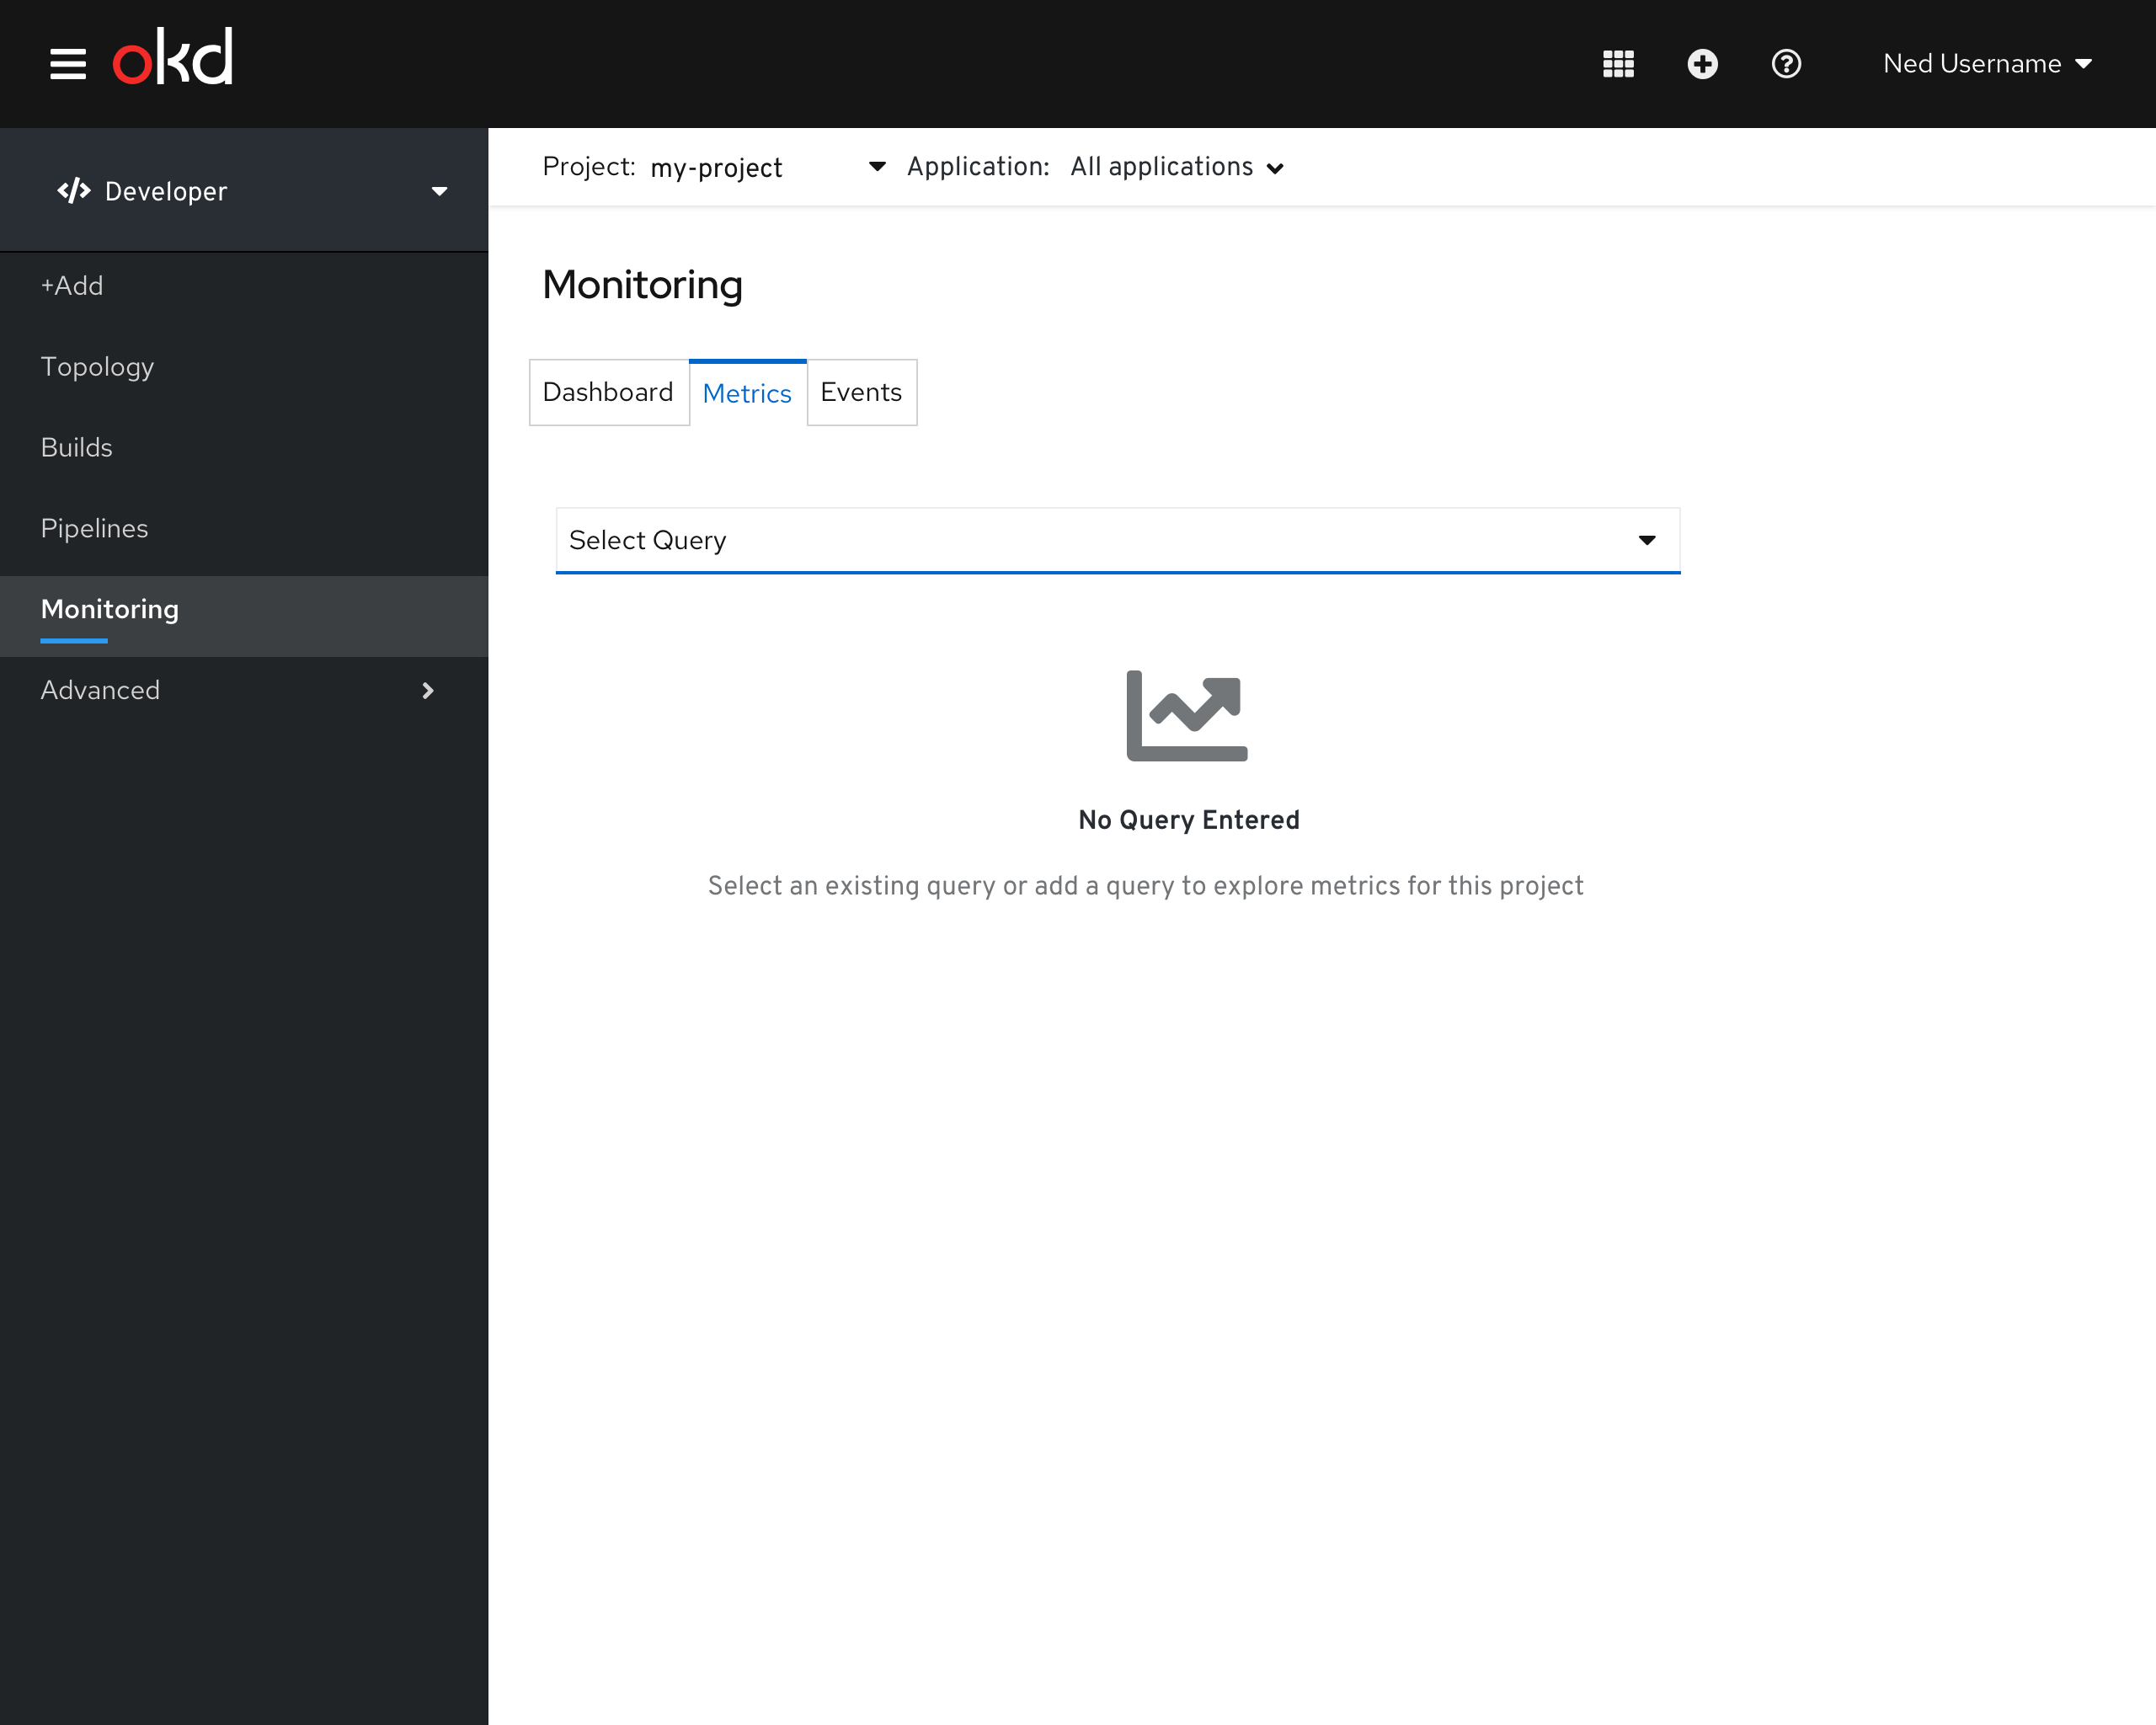
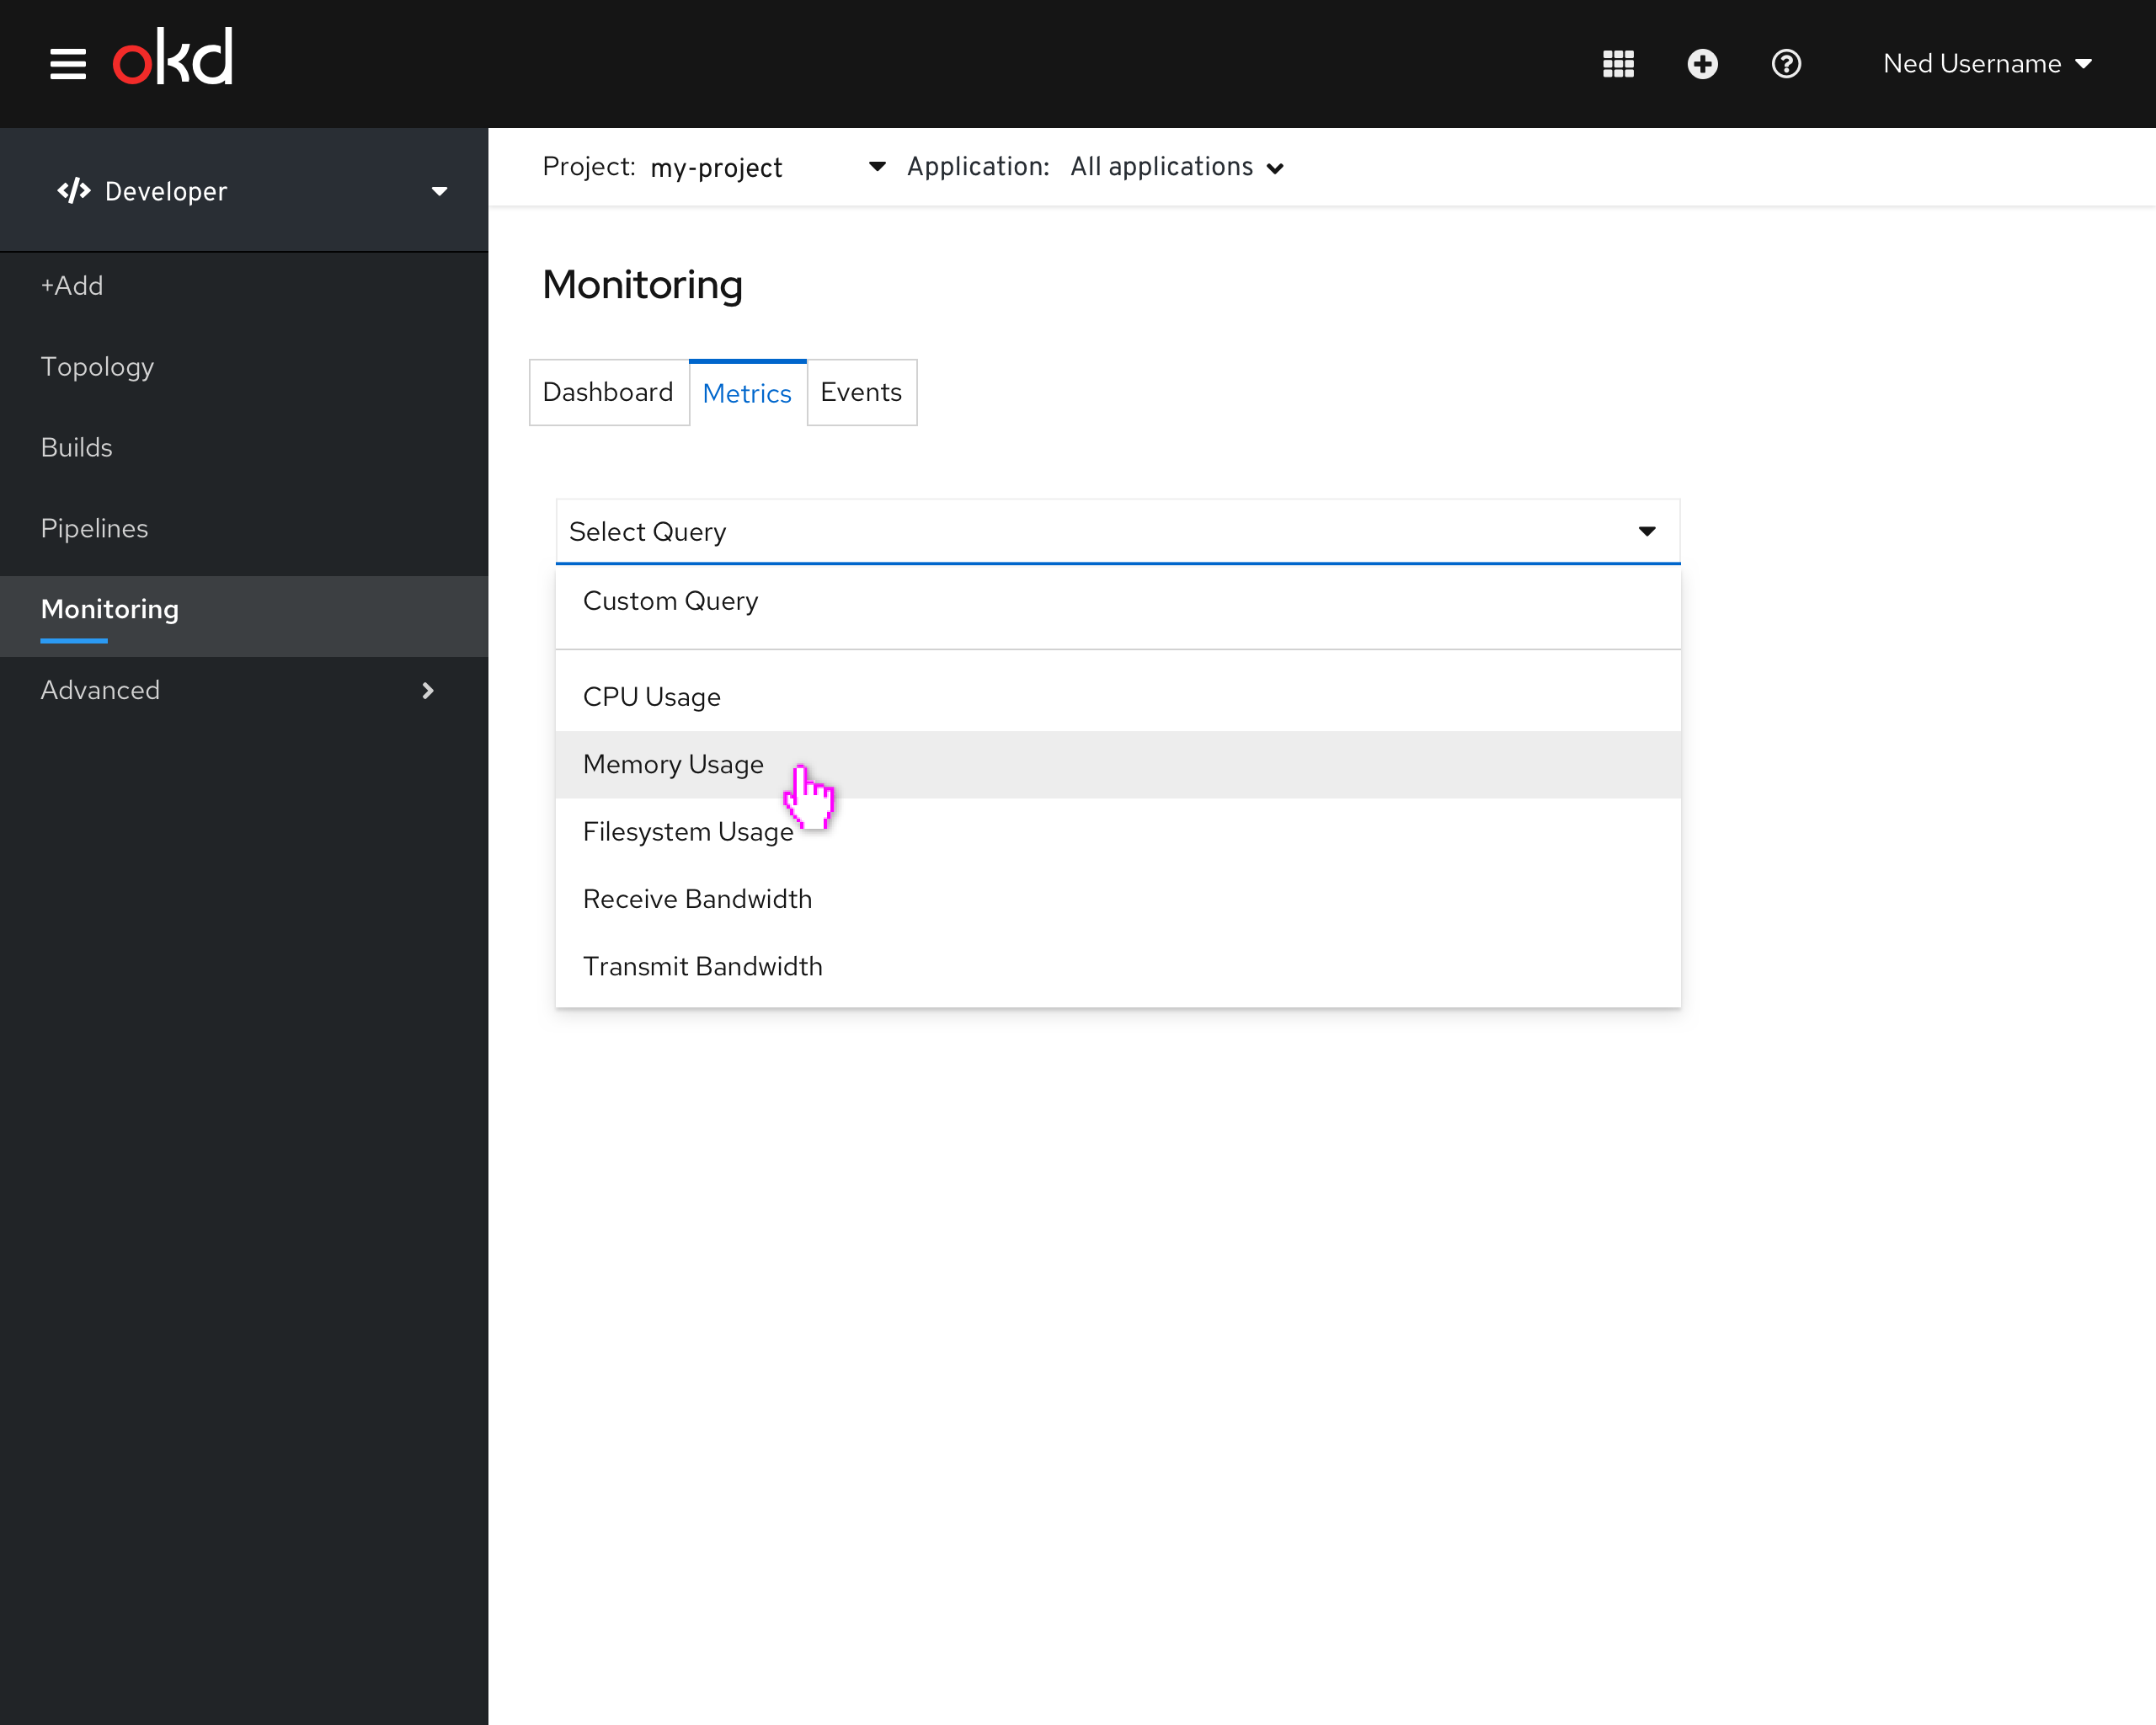
Monitoring - Selecting query
- The user can select from a number of out-of-the-box queries OR add a query via PromQL.
- The application selector allows the user to quickly view metrics for the entire project OR per application.
- Note that the Filter Queries item below is a FUTURE looking type-ahead feature.
Monitoring - View existing query
- Selecting an existing query plots the data on card and provides a legend, where each row acts like a toggle to allow that item to be shown/hidden
- When an existing query is selected, a Show PromQL link is available to allow the user to Show the PromQL editor, with the associated query in context
- The application selector allows the user to quickly view metrics for the entire project OR per application.
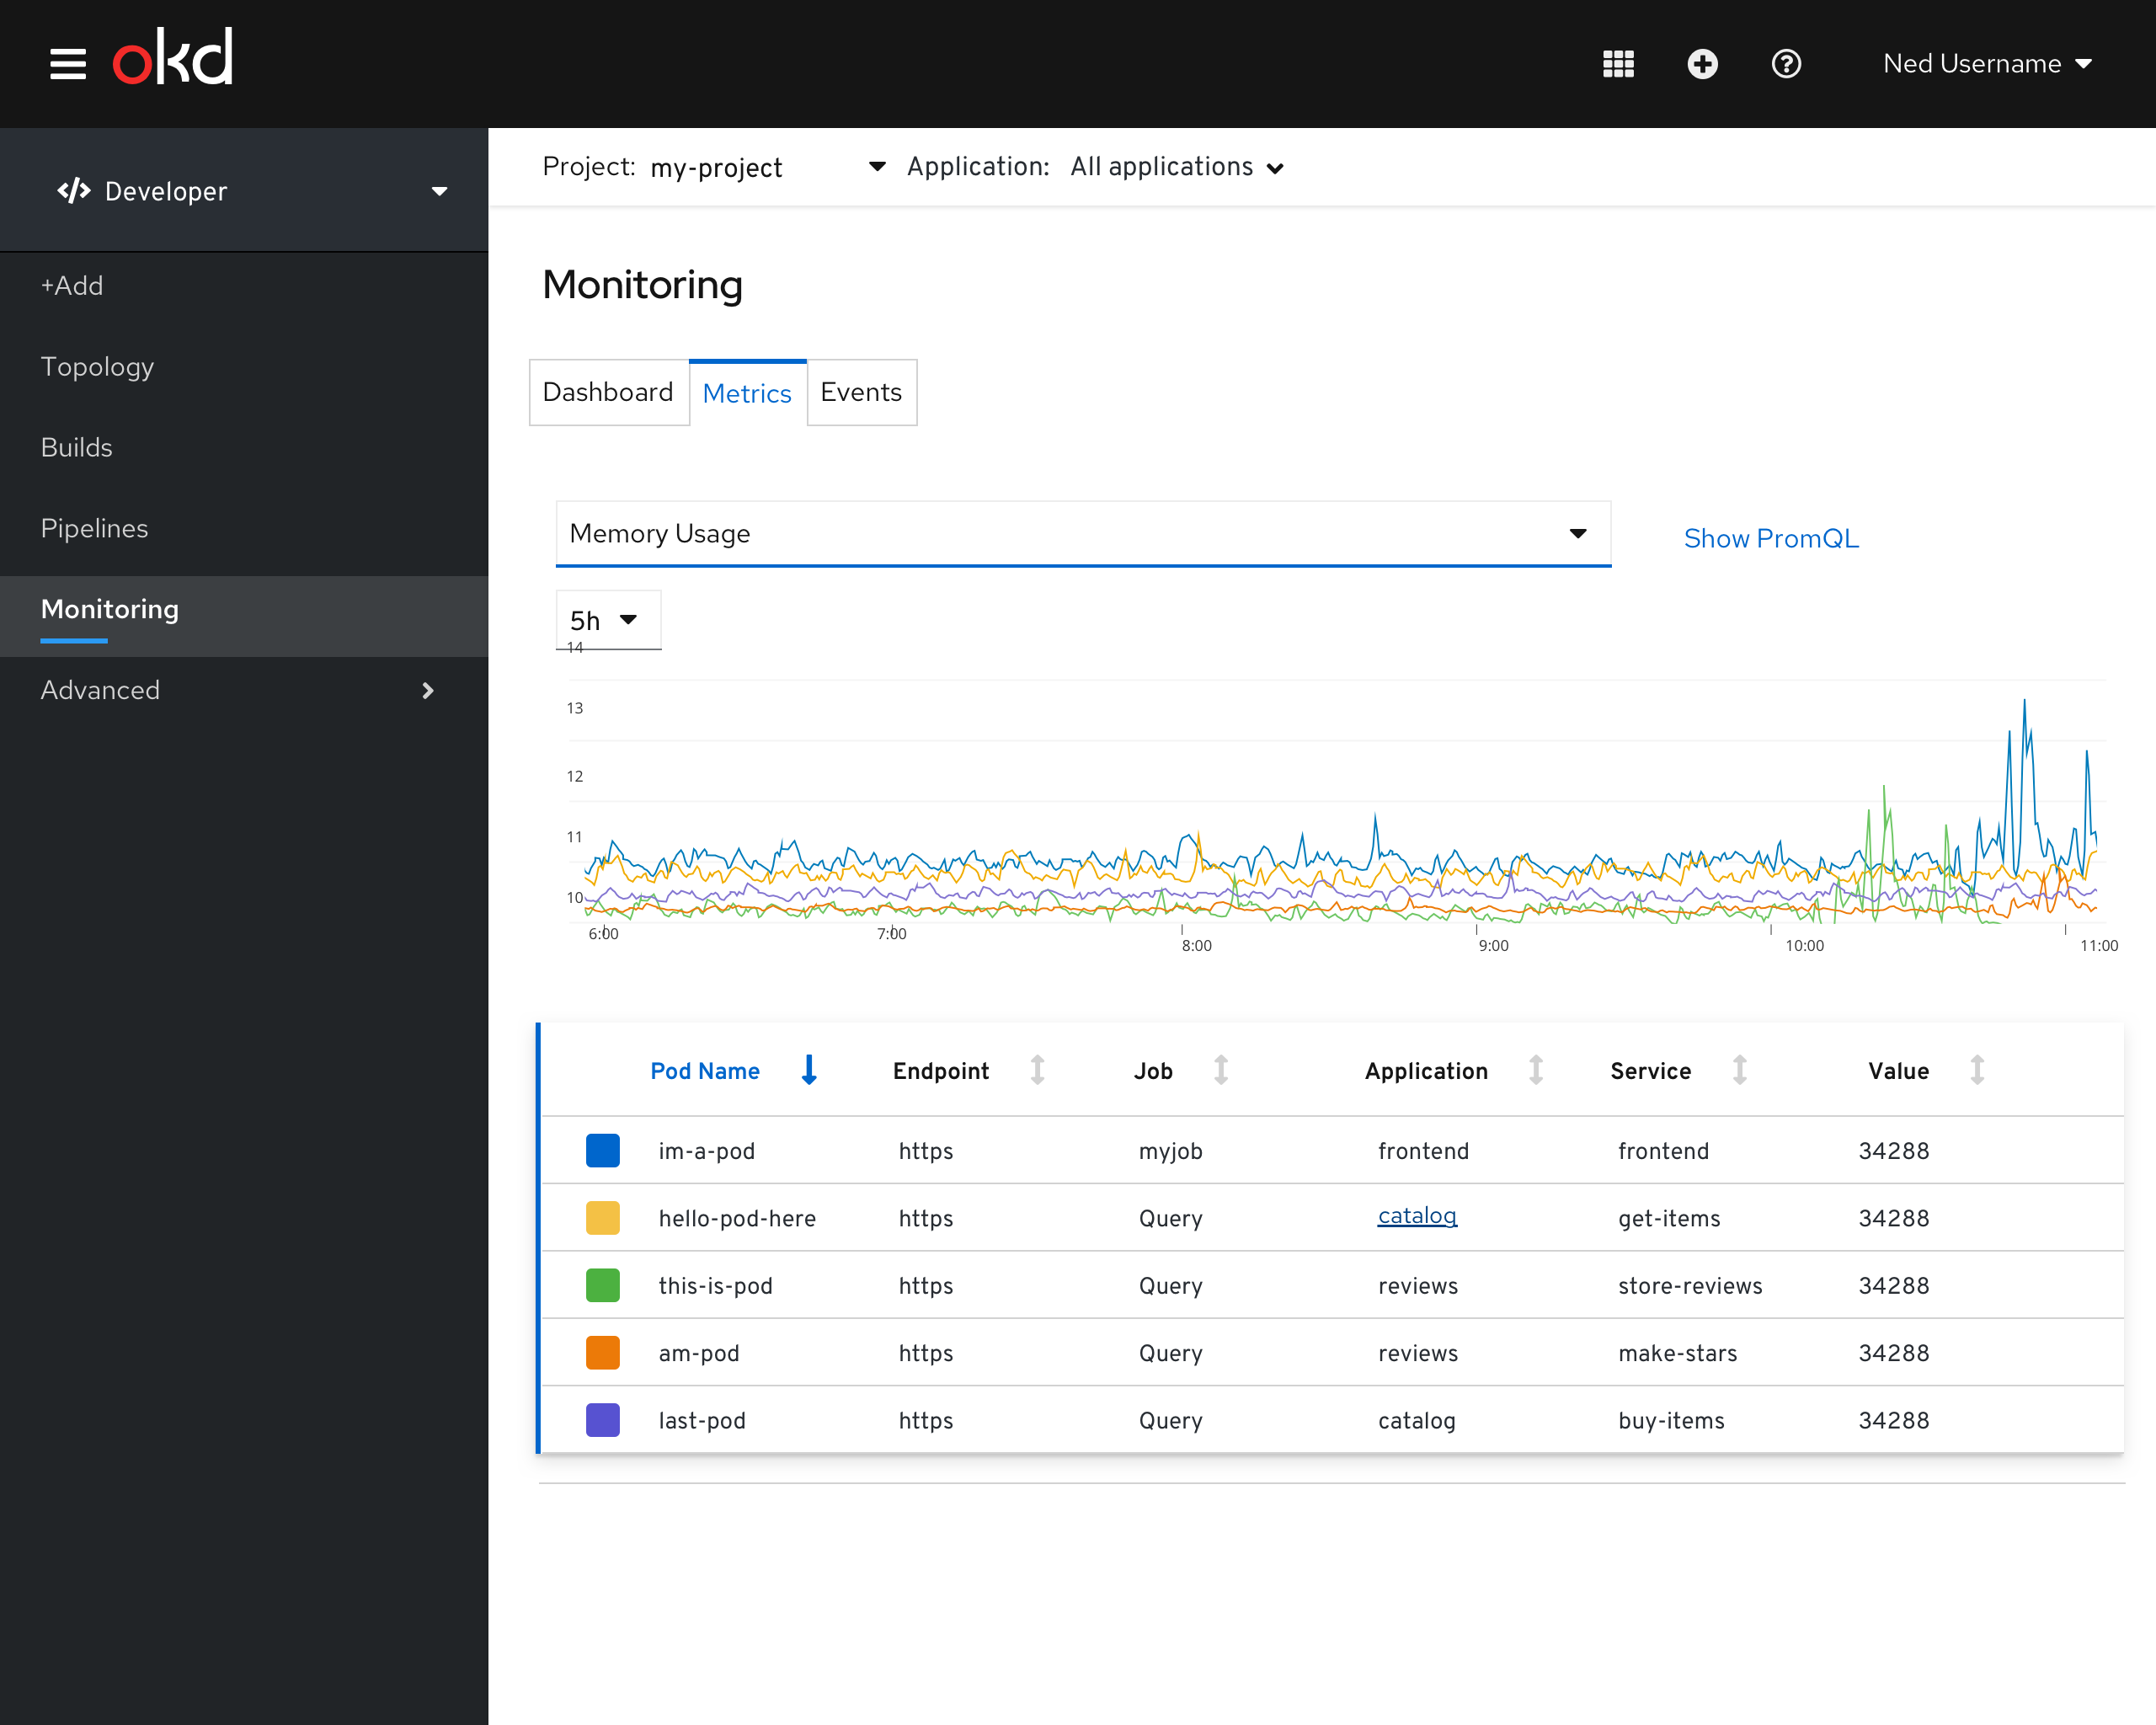
Available queries
- Pod CPU Usage
- Pod Memory Usage
- Pod Filesystem Usage
- Receive Bandwidth
- Transmit Bandwidth
Editing an existing query
When the user selects a pre-defined query, and then clicks Show PromQl and edits the PromQL, the default query selection should change to Custom Query
Monitoring - Create Custom Query
The user should be able to create a custom query.
- An entry will be available in the drop-down.
- When this entry is selected, it will show the PromQL input field, allowing the user to enter their own query.
- The application selector allows the user to quickly view metrics for the entire project OR per application.
In 4.4, this query will not be able to be saved.
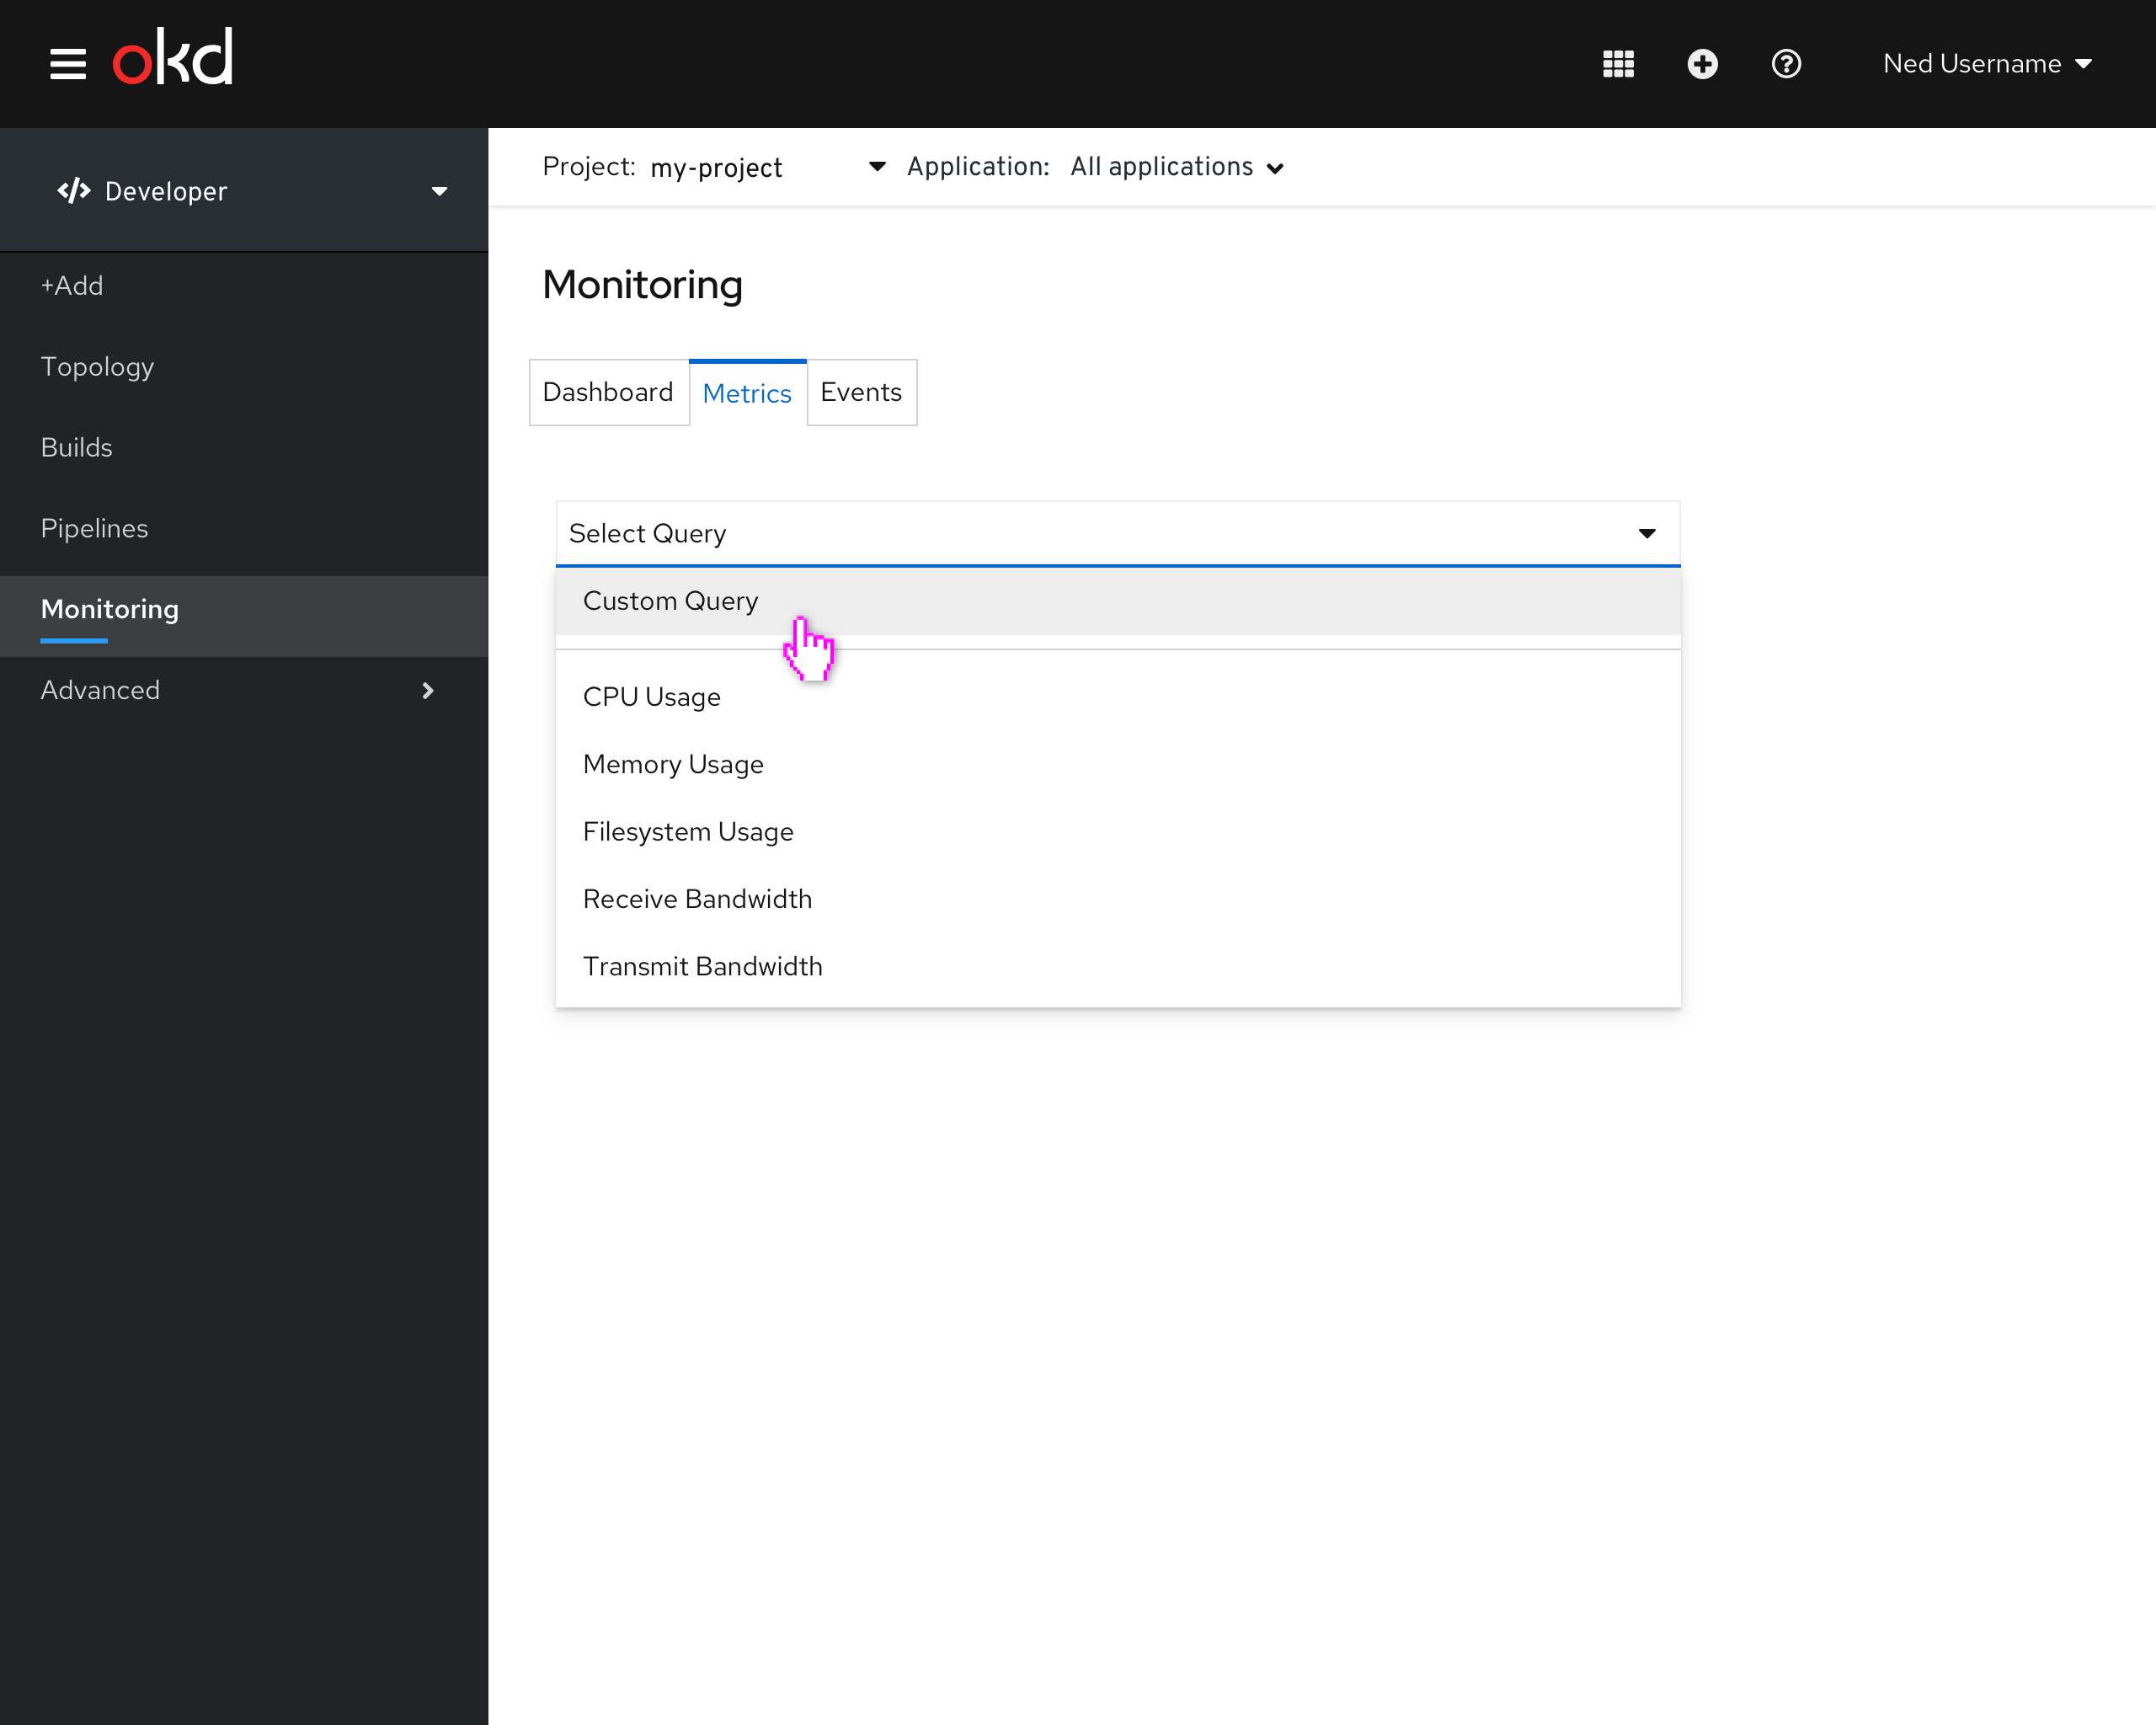
When Custom Query is selected, the PromQL input field is shown

Monitoring tab in the Topology side panel
Add labels to queries which allow the queries to be associated with the metrics tab for resource types Monitoring tab can include the following:
- Events (Warning)
- Associated with the resource in context
- Display a badge for the number of warning events
- By default, this accordion should be closed.
- Metrics
- Charts showing predefined metrics queries associated with the resource in context
- By default, this accordion should be open.
- All Events
- Associated with the resource in context
- By default, this accordion should be closed.
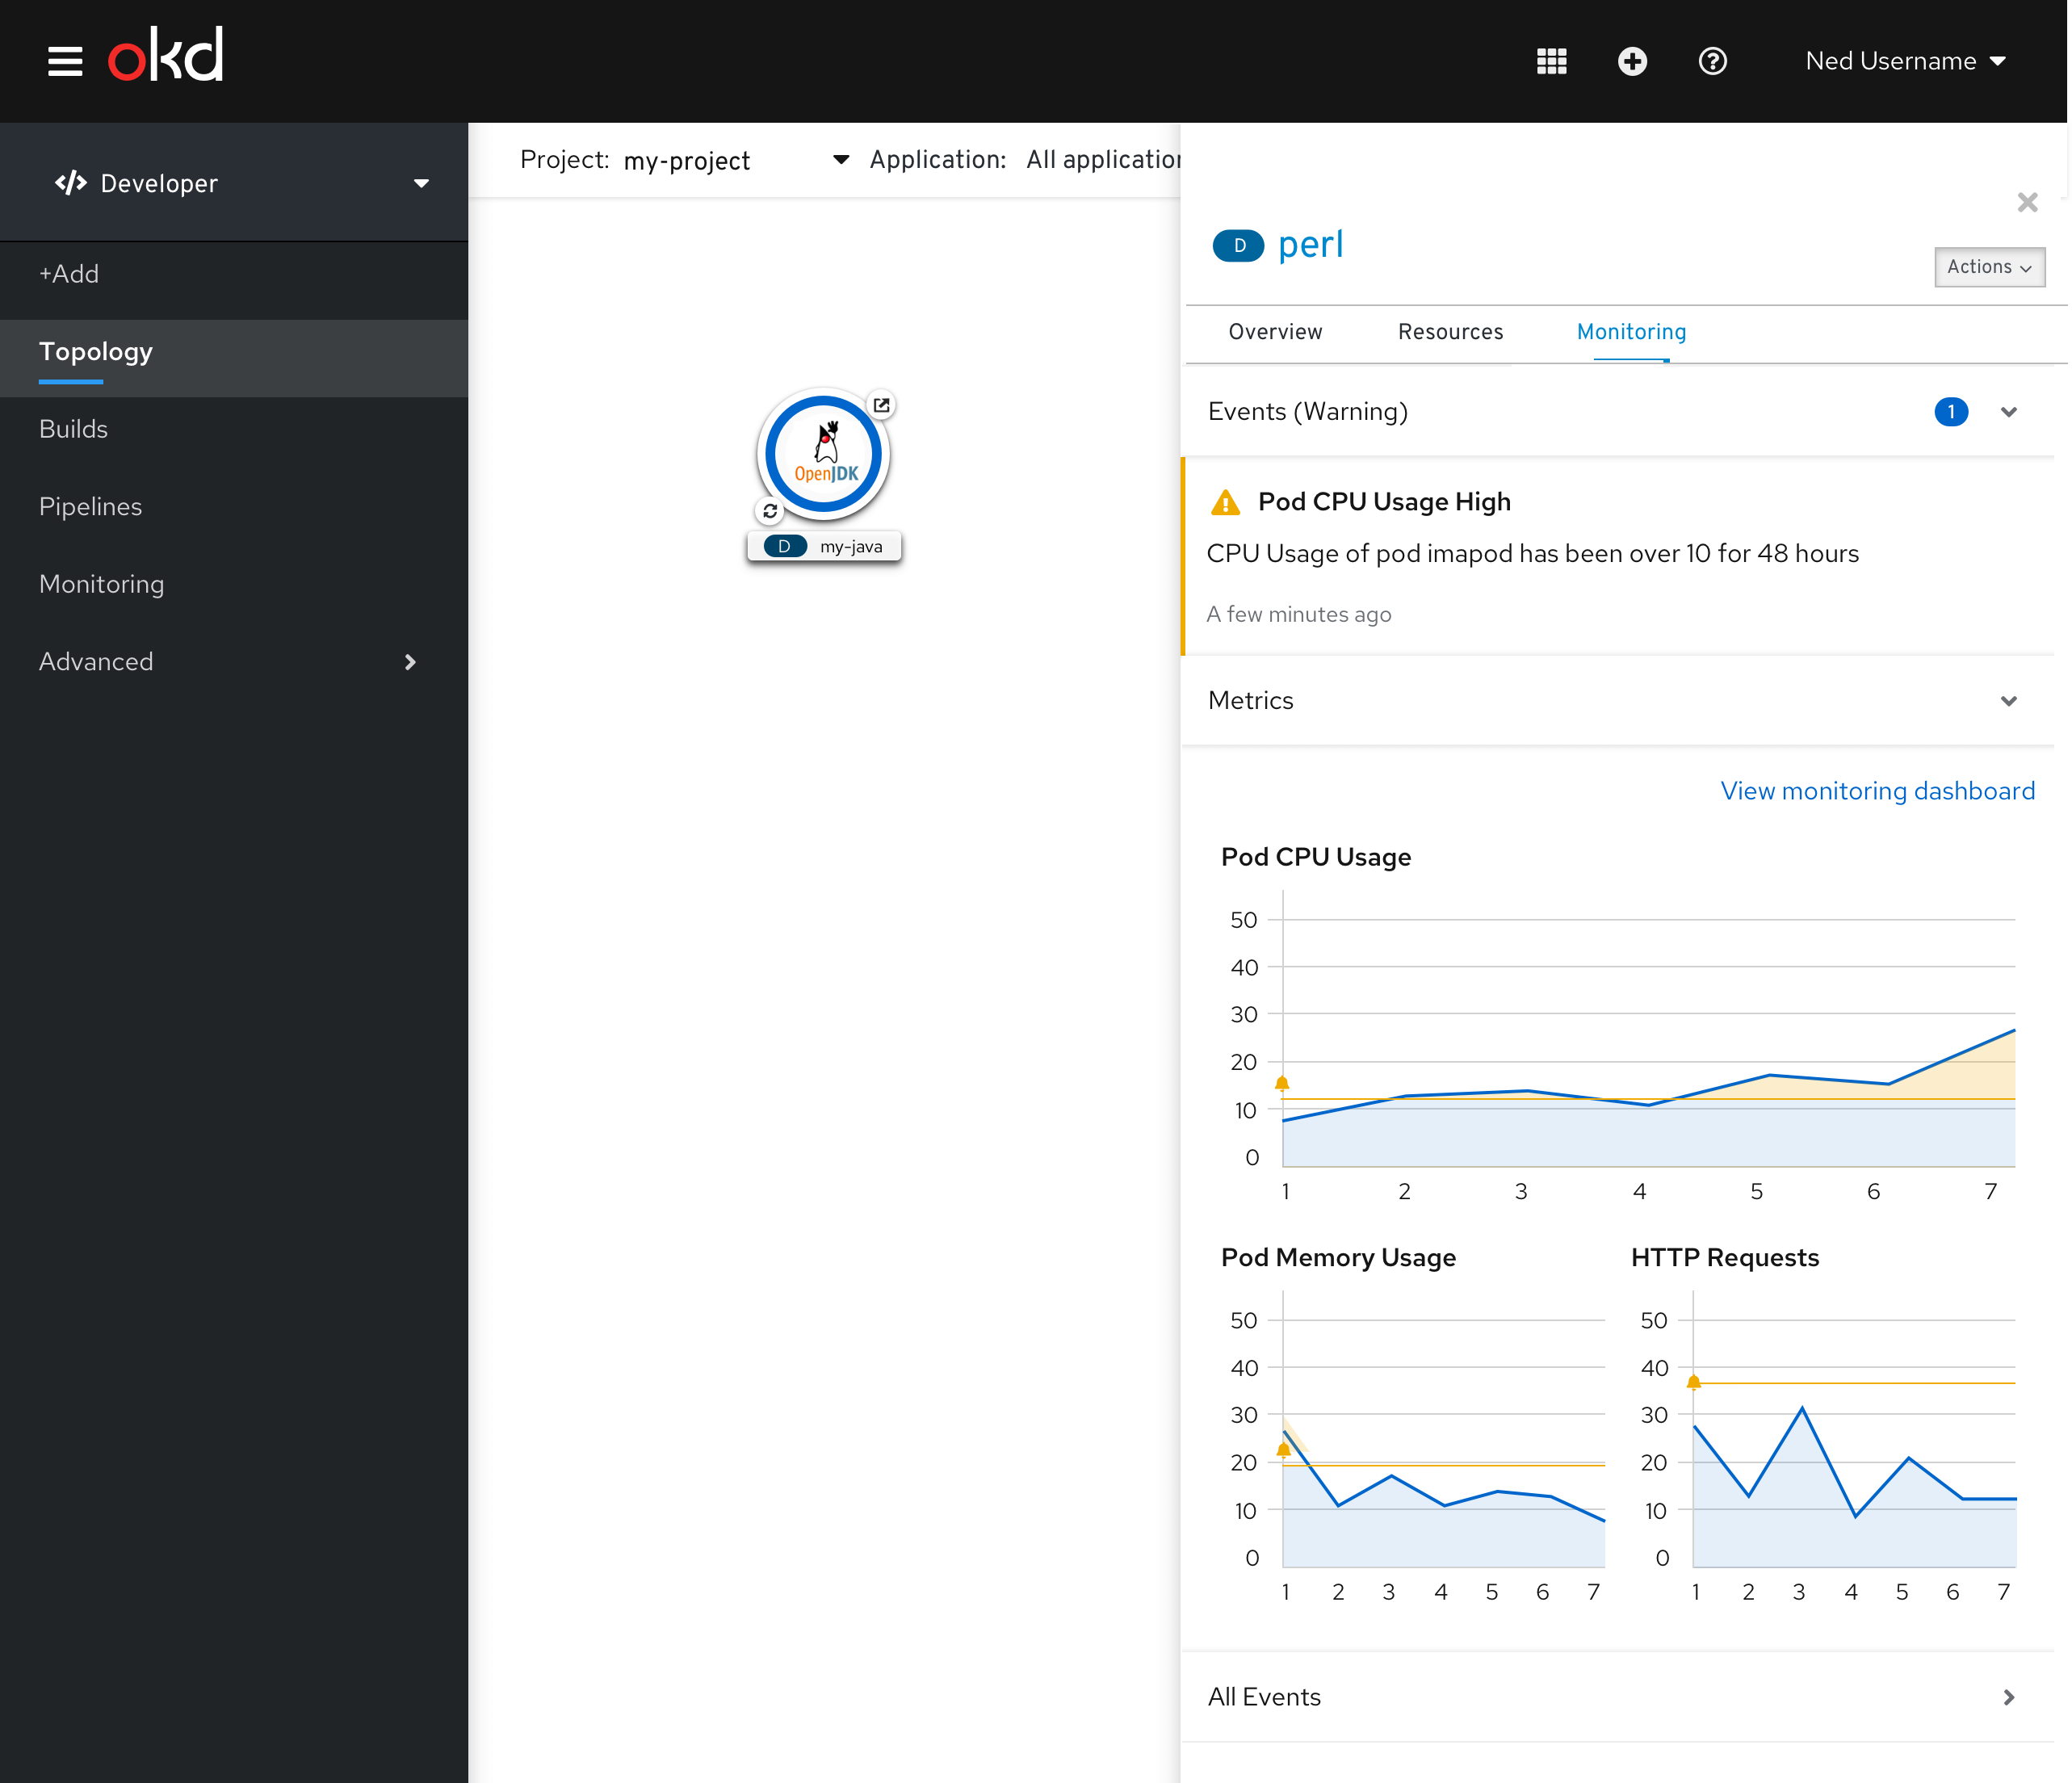
Available charts in the Metrics accordion
- CPU Message
- Memory Usage
- Receive Bandwidth
Accessing the dashboard from the Monitoring tab
A link should be available to allow the user to easily navigate to the monitoring dashboard with that object in context.